Rails infrastructure optimization: how to reduce costs before scaling

Your product is not growing, the traffic is flat, but the invoice from AWS or Google Cloud keeps climbing.
In situations like this, Rails often becomes the scapegoat: “it doesn’t scale” and “we’ve outgrown the stack.”
In our experience, Rails is rarely the reason. Most applications waste resources through misconfigured pools, idle connections, and code that blocks rather than executes. When performance drops, the default move is adding another server rather than finding what’s actually slow. Provisioning takes one click, while diagnosing the bottleneck requires harder work.
Infrastructure waste masks the real problems. CPU hovering below 30% while monthly costs rise means you’re funding idle capacity, verbose logs, and threads waiting on external calls. Before spinning up more instances or planning a rewrite, map where the budget actually drains.
Why scaling Rails infrastructure masks deeper problems
Clicking the “scale up” button in your cloud console can feel like an instant win. Alerts quiet down, and the product looks stable again.
But many Rails slowdowns are not caused by “not enough servers.” They come from slow database queries, locked rows, third-party APIs, or backed-up queues. When the system is waiting, more instances only add idle capacity around the same bottleneck.
That is how scaling turns into waste: capacity is added before the constraint is proven. The app may feel better for a while, but the inefficiency remains and the bill keeps growing. We cover scaling options in more detail in our guide on how to scale a Ruby on Rails application for high traffic.
In practice, this usually happens in two ways: overprovisioning for safety and misreading low CPU as healthy capacity.
Overprovisioning as the default safety measure
Hardware is infinitely easier to add than bad architecture is to fix. Dragging a slider in AWS takes four seconds, while tracking down an inefficient query takes days of focused engineering.
That gap encourages overprovisioning: extra instances “just in case,” bigger workers “for safety,” and higher limits that never get rolled back. It reduces short‑term risk, but it also turns uncertainty into a recurring monthly cost.
What this looks like in practice:
- You keep “peak” capacity running after an incident is over.
- You raise Sidekiq concurrency and add workers, even though the database is the real limit.
- You upsize instances because memory spikes happen without identifying what is spiking memory.
- You increase timeouts and retries to “stabilize,” and the system quietly does more work per request.
So the system looks safer, but it gets more expensive and harder to improve because you’re paying for insurance instead of removing the constraint.
The low CPU illusion
Cloud spend can increase even when load is steady because you are paying for capacity that is waiting, not computing. Ruby applications often spend a surprising amount of time waiting rather than executing code. Threads blocked on PostgreSQL, Redis, or HTTP calls barely consume CPU, so servers can look idle while users are still waiting.
A CPU can stay low and still signal a problem. If latency is high, the app is usually blocked somewhere else: Ruby memory pressure, garbage collection, database queries, queue backlogs, Redis, or external services.
Production APM tools such as Scout APM or New Relic can help by separating request time into database time, view rendering, external HTTP calls, background job execution, and Ruby code. For deeper cases, rbspy or stackprof can show whether the process is actually burning CPU or spending time in specific Ruby methods, serialization, JSON parsing, encryption, template rendering, or gem code.
| Symptom | What it usually means | Impact |
| Low CPU + high memory | Workers are RAM-heavy (large job payloads, big Ruby heaps, GC overhead) | You upgrade instances mainly for memory |
| Low CPU + High DB time | Queries are slow or stuck (missing indexes, lock contention, pool starvation) | App scaling doesn’t help much; DB costs still rise |
| Low CPU + latency spikes | Waiting on external calls, network, or queues | You pay for servers that mostly wait |
In these cases, CPU is the wrong metric to scale on. You need to look at DB time, queue depth, and external call latency.
Red Flags that your app is hemorrhaging money
You don’t need to read Ruby to spot waste. Look for these patterns:
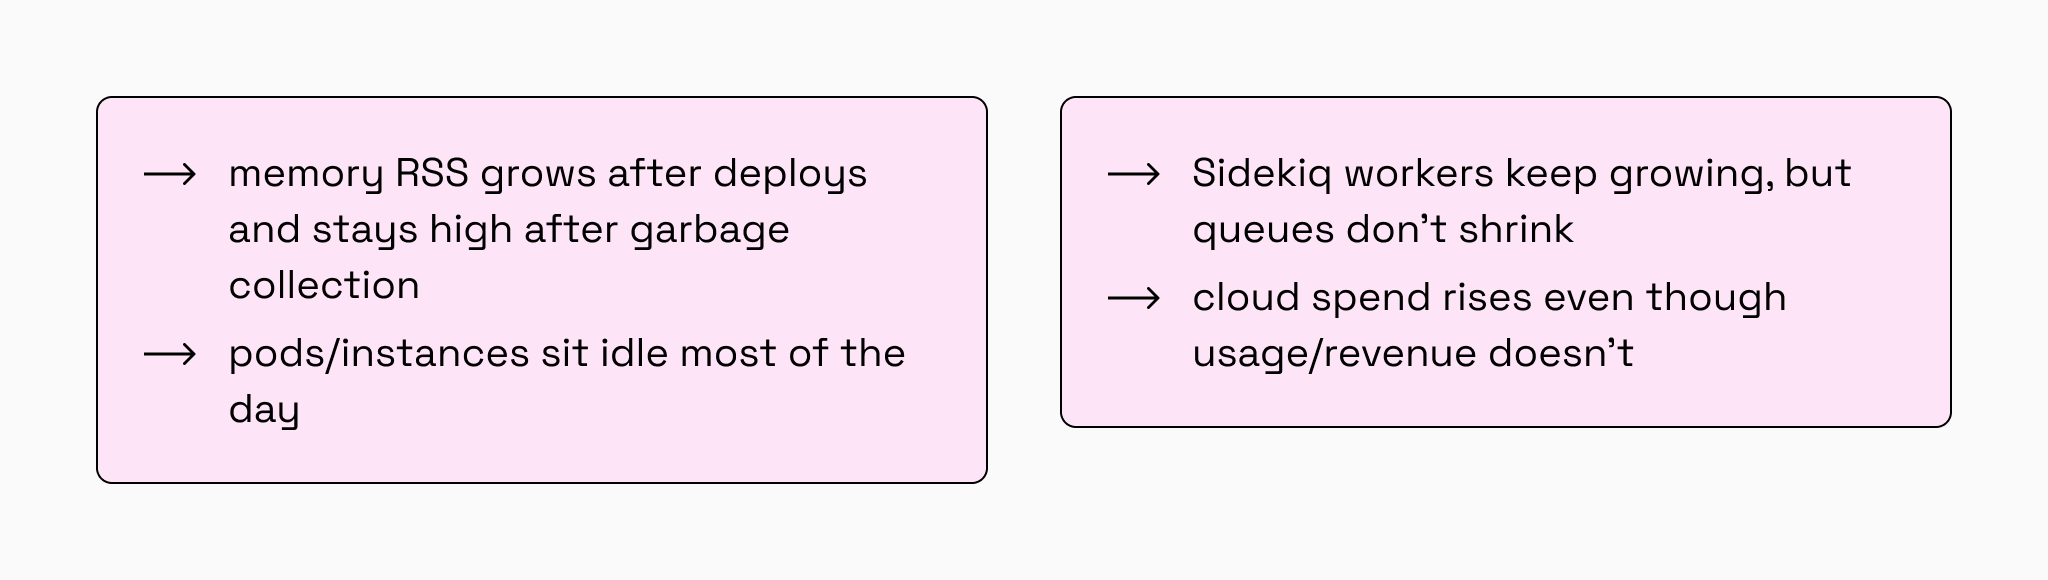
These red flags should be verified with Rails-specific diagnostics, not only cloud graphs. APM traces show which endpoints and jobs consume time. pg_stat_statements shows which SQL queries create database load. Bullet can expose N+1 queries before they reach production. derailed_benchmarks and memory_profiler help explain why Ruby processes need more RAM after a deploy.
The good news is that these leaks are rarely mysterious. A structured Rails infrastructure review can show exactly where your cloud budget is going: database waits, blocked web threads, oversized workers, queue backlogs, external API latency, Redis growth, or noisy logs.
As part of our Ruby on Rails development services, we help teams turn that data into a practical action plan: reduce recurring cloud waste, protect performance, and decide what actually needs to scale. With the right review checklist, the leaks show up clearly in dashboards, traces, and the bill.
Rails infrastructure costs: 5 leaks that burn budget
Before we look at the specific leaks, let’s look at where your AWS invoice actually comes from. In a typical Rails stack, your bill is a combination of these layers:
EC2 (Compute) + RDS (Database) + Redis (Cache/Queues) + Load Balancers + Network Egress + Observability (Logs/Storage).
The biggest mistake teams make is confusing server count with actual utilization.

When we audit infrastructure at Rubyroid Labs, we rarely find fundamental flaws in the Ruby on Rails framework. We find mundane allocation mistakes across those billing layers. Here are the five most expensive black holes hiding in your invoice.
01. Oversized Puma and DB pools increase Rails infrastructure costs
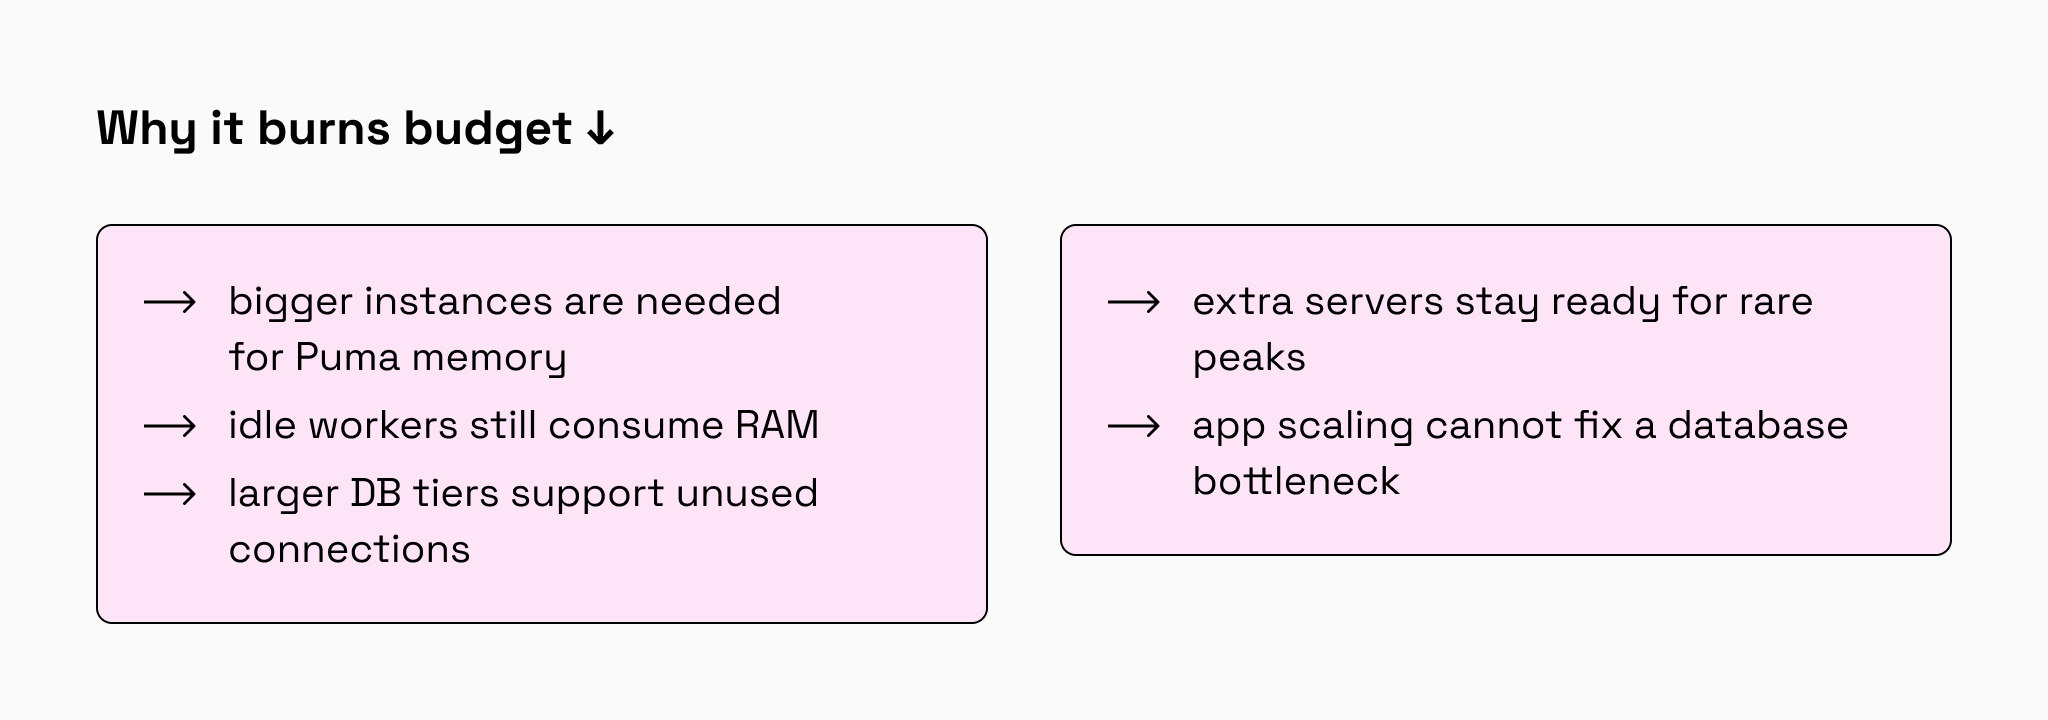
Your cloud bill stays stably-high even during quiet weeks. Engineers keep large instances “for peak traffic,” but those peaks rarely arrive or do not require as much capacity as expected.
The mechanics
To prevent errors, teams often configure Puma with too many workers and set Rails database connection pools higher than real concurrency requires.
In clustered mode, Puma runs multiple forked worker processes. Each worker has its own Ruby heap and memory overhead. Copy-on-write can reduce memory usage after forking, but the benefit fades as workers allocate new objects, load application code, process requests, and trigger garbage collection. The result is higher per-worker memory usage, even when those workers are mostly idle.
Oversized database pools create a similar problem. Every extra pool slot can become an open database connection, increasing pressure on PostgreSQL or MySQL without increasing actual throughput.
In a Rails audit, we usually validate this with Puma worker memory, ActiveRecord connection usage, APM traces, pg_stat_statements, and memory tools like derailed_benchmarks or memory_profiler.
Our approach at Rubyroid Labs
We measure real concurrency. We right-size Puma threads and slash the Rails DB pool to match the observed demand. You get fewer processes holding less memory, retaining enough headroom for actual peaks without paying the year-round tax.
02. How third-party slowness increases Rails server costs
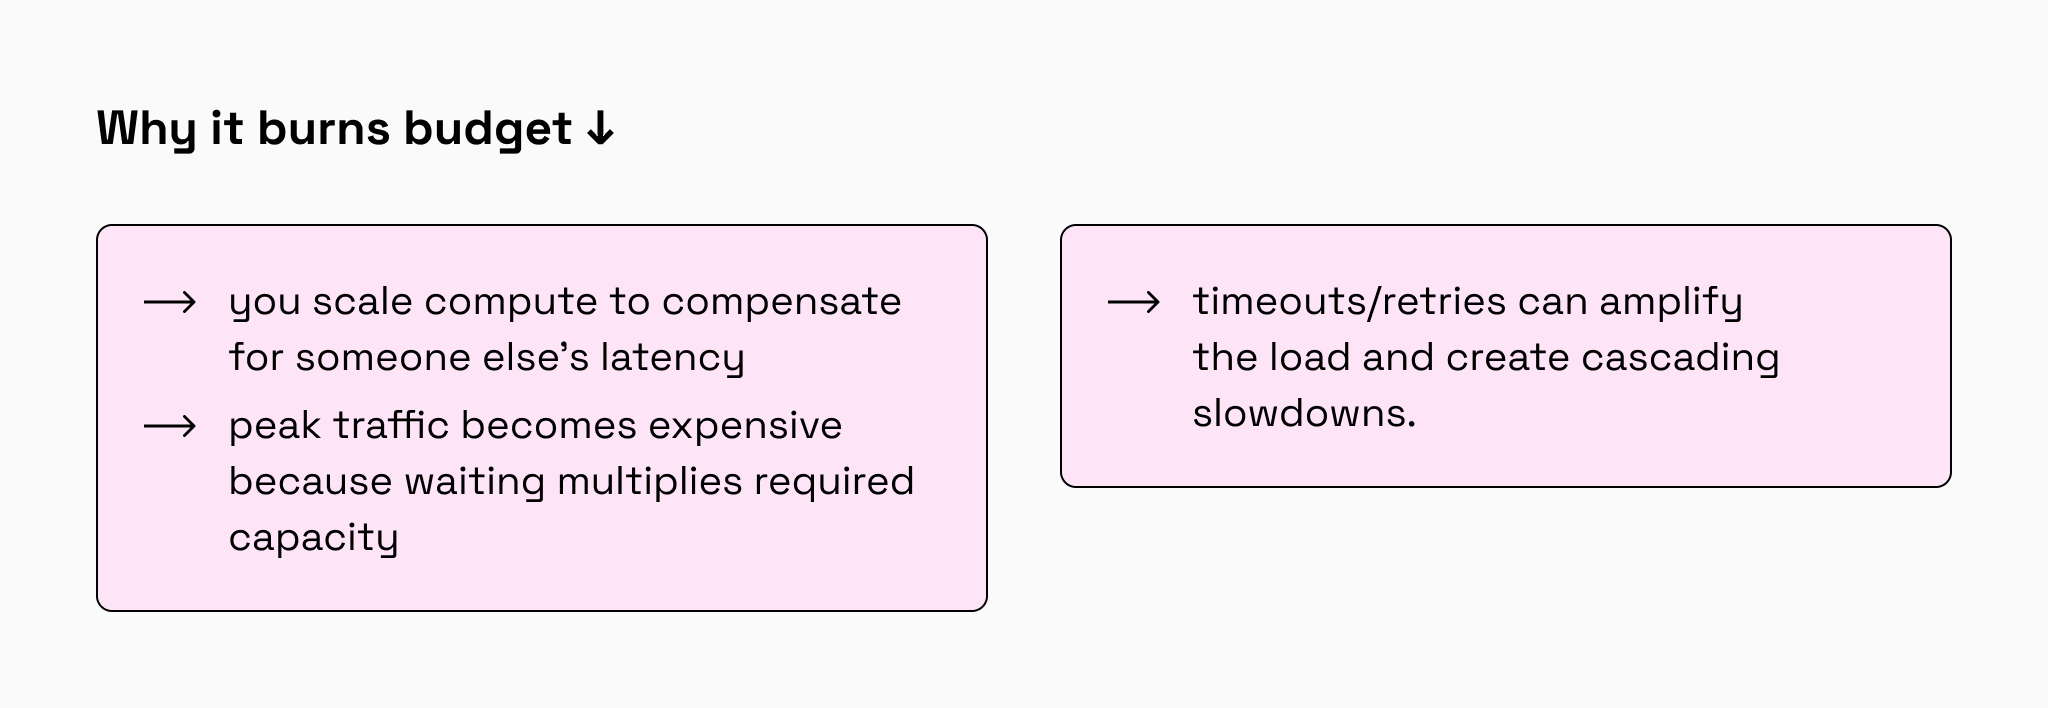
Core user flows like checkout, sign-up, or CRM sync feel randomly slow. The infrastructure automatically scales up, but the timeouts keep happening.
The mechanics
Your app relies on external APIs (Stripe, Salesforce, etc.). When those third-party services respond slowly, your Rails server threads sit blocked, waiting. While they wait, they cannot serve other users. APM traces from Scout or New Relic usually make this visible quickly: the request is not slow because Rails is “bad,” but because web threads are waiting on external HTTP calls.
Our approach at Rubyroid Labs
We redesign the flow. We move non-critical API calls to background jobs, enforce strict circuit breakers, and cache safe responses. As a result, there are fewer blocked threads and an immediate drop in “scale to survive” compute spend.
03. Poor Redis cache design increases Rails infrastructure costs
Your Redis memory usage climbs month over month until you hit latency spikes or have to upgrade to a larger tier.
Note: While modern Rails 8 architecture is increasingly moving away from heavy Redis reliance to Solid Queue, legacy setups can still bleed cash here.
The mechanics
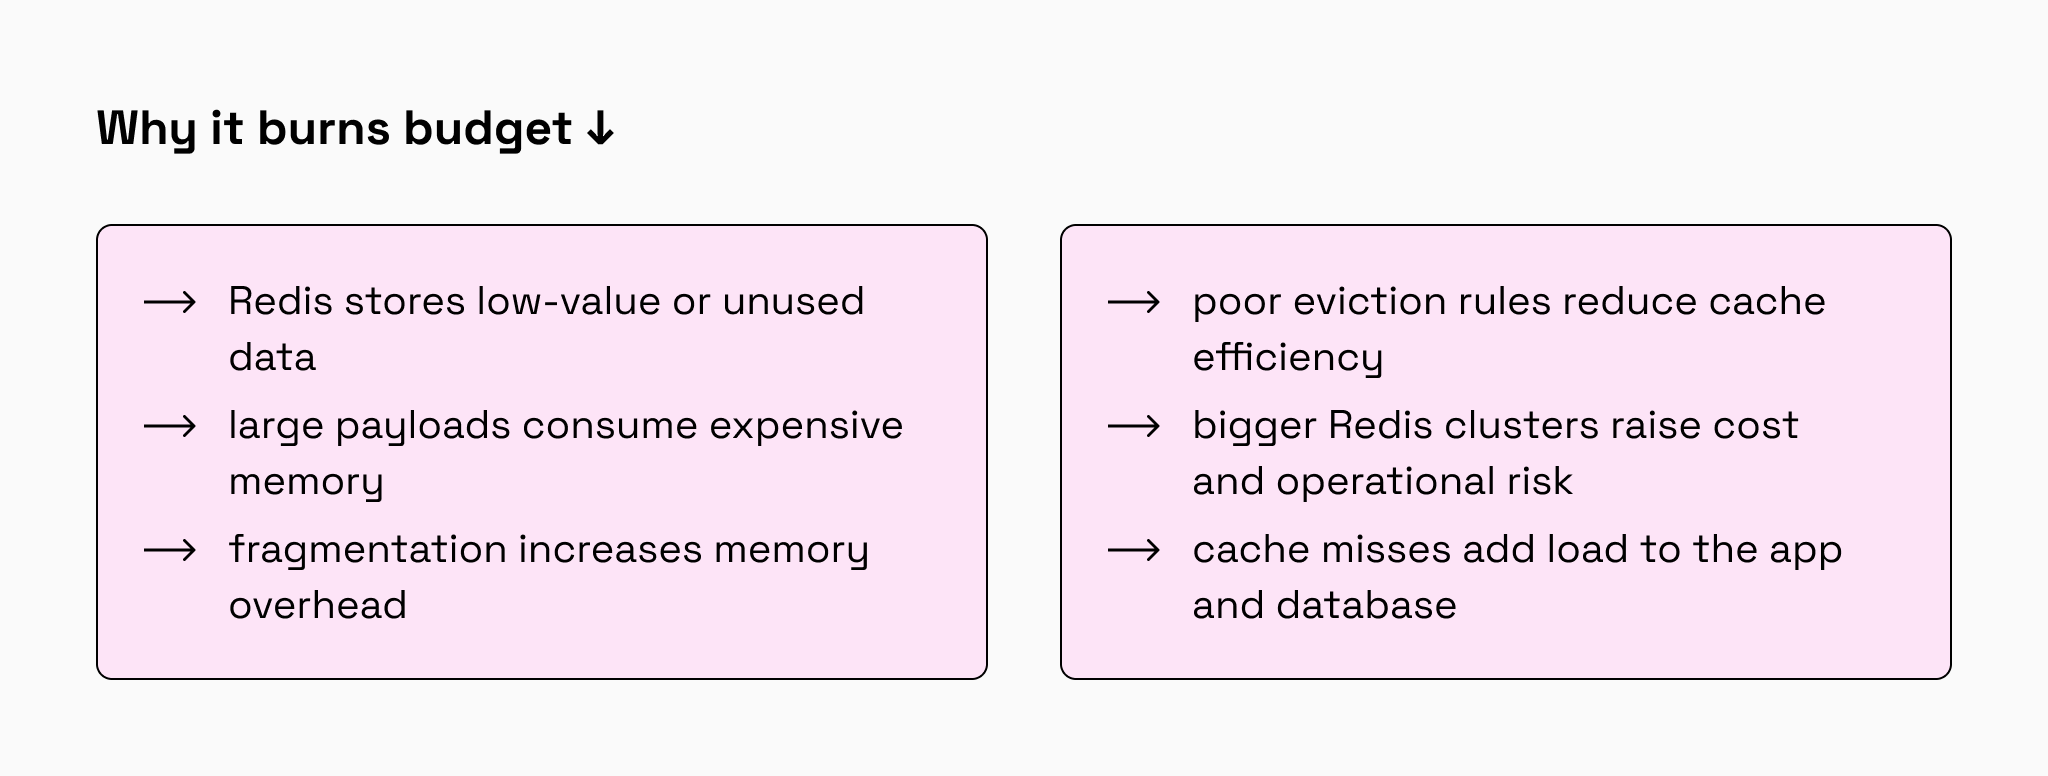
Teams use caching to speed up pages, but the cache often grows without clear rules. Redis ends up storing large serialized objects instead of small reusable values or simple IDs. In Rails apps, this can mean heavy Marshal dumps, oversized JSON payloads, or objects with fields the application does not actually need on read.
Serialization overhead matters because the payload stored in Redis is often larger than the useful data it represents. Over time, large values, short-lived keys, and uneven key sizes can also increase memory fragmentation, so Redis may reserve more memory than the application effectively uses.
Eviction policy is another common source of waste. If keys have no TTL, or if the eviction policy does not match the cache behavior, Redis may keep low-value data while useful hot keys get pushed out. The result is a poor cache hit ratio: you pay for high-performance memory, but the application still falls back to the database or recomputes the same work.
In Rails apps, we verify this by looking at cache hit ratio, Redis key sizes, TTL coverage, APM cache spans, and object allocation patterns with tools like memory_profiler when serialization becomes suspicious.
Our approach at Rubyroid Labs
We audit keyspace growth, cache hit ratio, payload size, TTL coverage, eviction policy, and memory fragmentation. Then we shrink serialized values, replace heavy Marshal or JSON payloads where possible, add strict expirations, and remove “write-only” caches.
This stabilizes Redis memory usage, improves cache efficiency, and can make it possible to move to a smaller, cheaper Redis tier.
04. How uncontrolled logging increases your Rails infrastructure bill
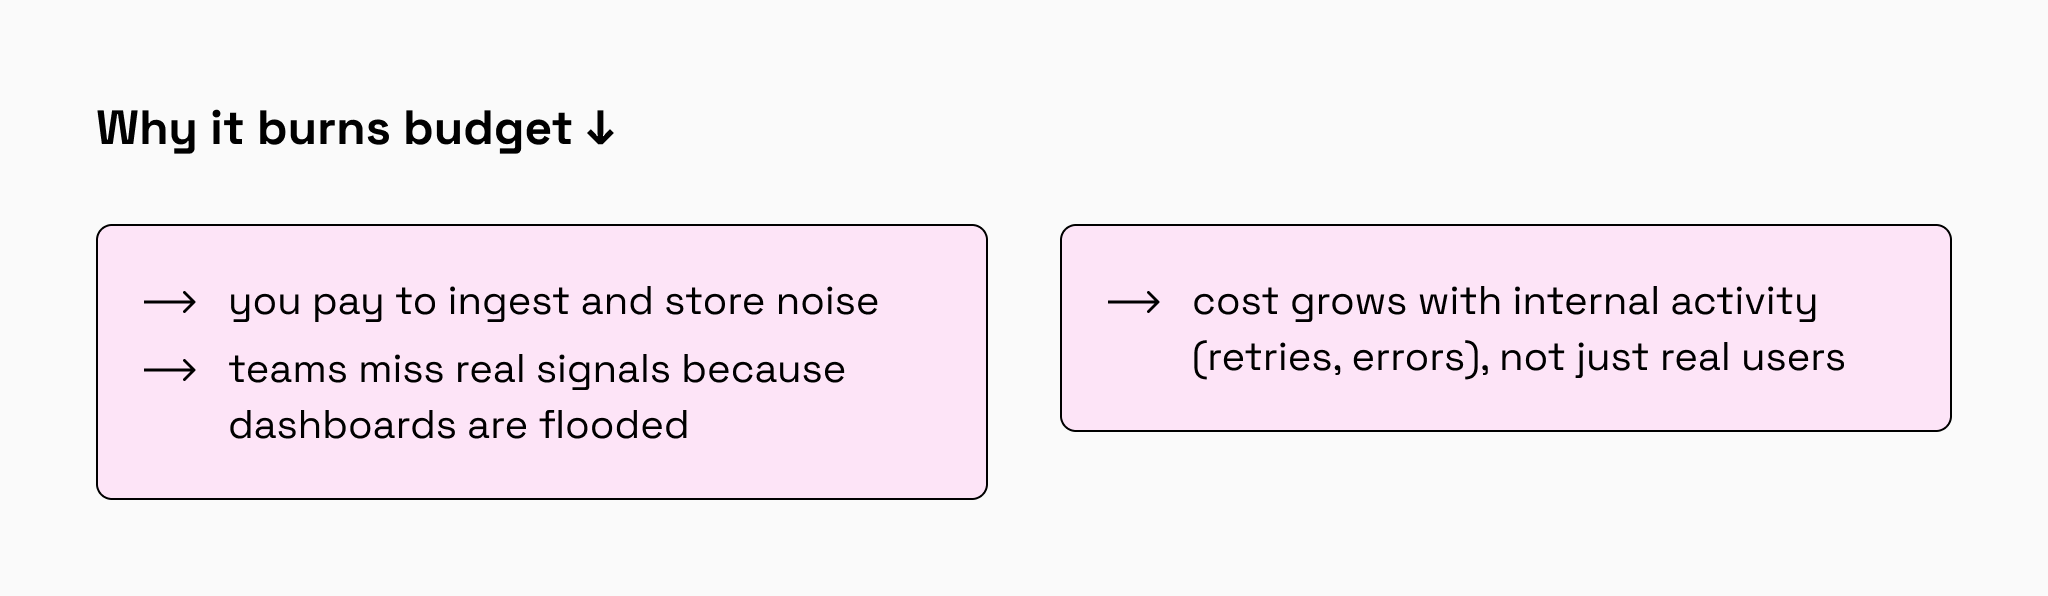
Your Datadog/New Relic/ELK bill grows faster than AWS/GCP itself. Costs spike during incidents, and you’re paying heavily to store logs you never read.
The mechanics
Data multiplies as it moves. Your log pipeline usually looks like this: Application Error → AWS CloudWatch → Datadog → Storage → Your Invoice. Every step charges a toll. If the app logs huge payloads or high-cardinality data (like full URLs with unique user IDs), the volume explodes precisely when an incident occurs.
APM data can also reveal noisy controllers, repeated exceptions, and background jobs that generate disproportionate log volume.
Our approach at Rubyroid Labs
We implement aggressive log sampling, strip out massive payload logging, and standardize error tracking. Observability spend drops, and finding the root cause during an outage becomes much faster.
05. Why autoscaling can increase Rails infrastructure costs
The system survives incidents, but the baseline cost keeps rising, and every spike leaves you with more always-on capacity.
The mechanics
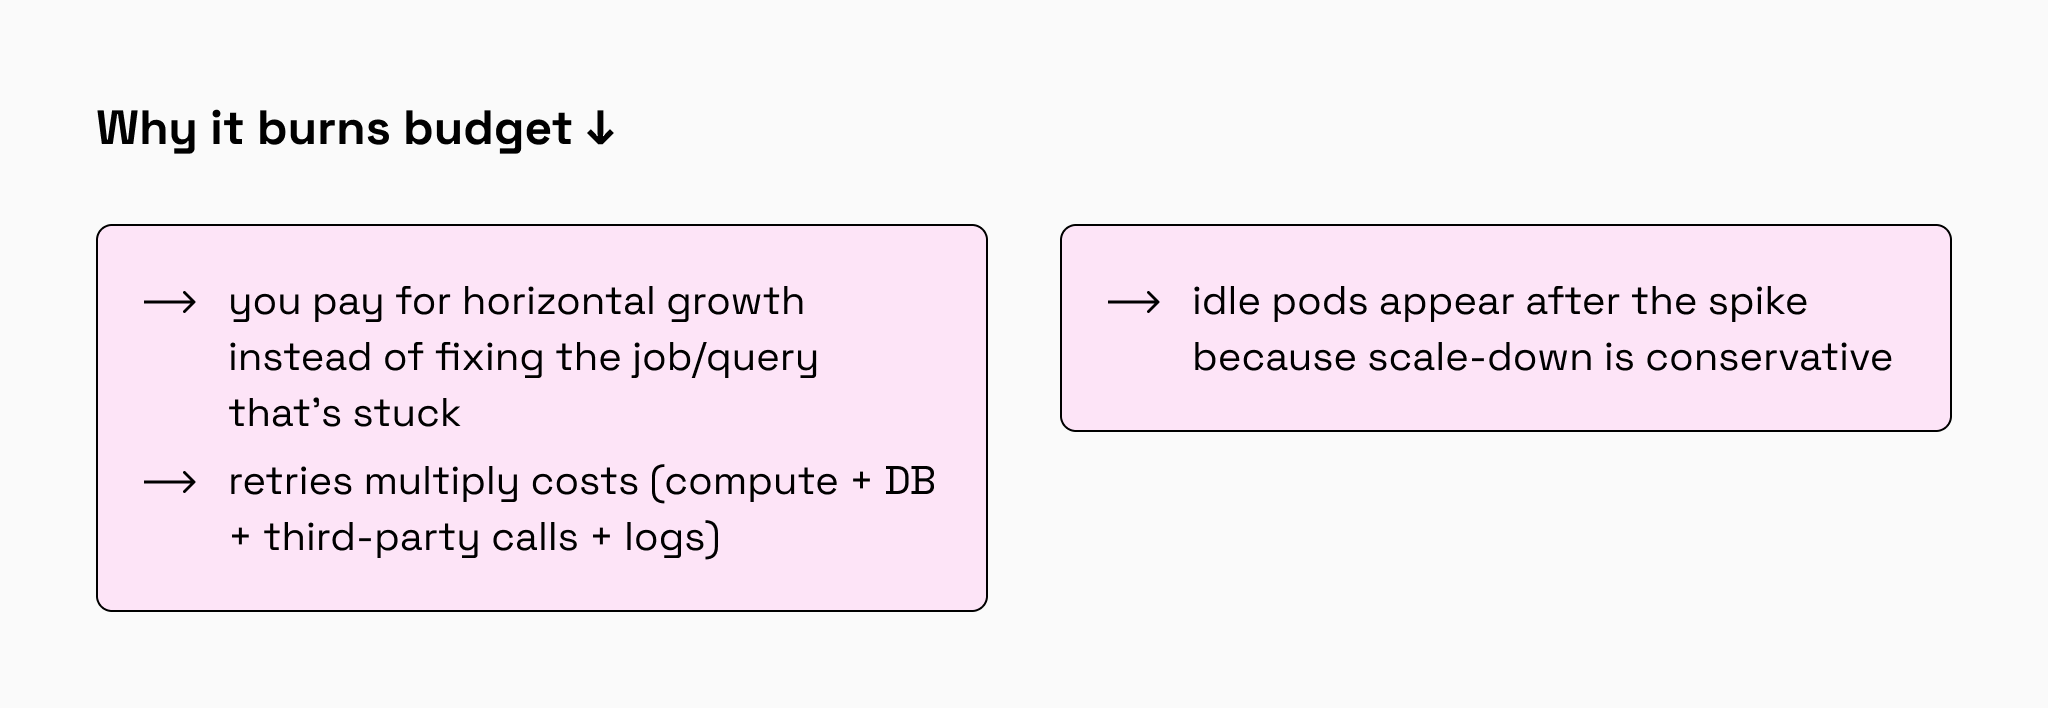
Auto-scaling adds pods or Sidekiq workers when queues grow. This is great for reliability but terrible for hiding inefficiency. If a background job fails, it retries. If it fails 10,000 times, you get a retry storm. The platform automatically buys more servers just to process those failures.
We verify this through Sidekiq queue latency, retry sets, job-level APM traces, and pg_stat_statements when background jobs repeatedly hit the database.
Our approach at Rubyroid Labs
We find the specific queues forcing the scale-outs, then we cap Sidekiq retries, push poison jobs to a dead-letter queue, and fix the underlying slow queries (N+1s). The backlog clears normally, and the auto-scaler stops draining your credit card.
How to scale Ruby on Rails without wasting money
Efficient Rails scaling starts with understanding utilization. Before moving to a more expensive AWS or Google Cloud tier, check whether the application has truly reached its limit or whether existing capacity is being used poorly.
This is a common pattern in our Rails code audits, especially when teams ask us to investigate rising infrastructure costs, performance issues, or unclear scaling limits. Often, a few targeted changes such as a missing index, blocked web threads, oversized workers, or slow external dependencies can delay an infrastructure upgrade or reduce its scope.
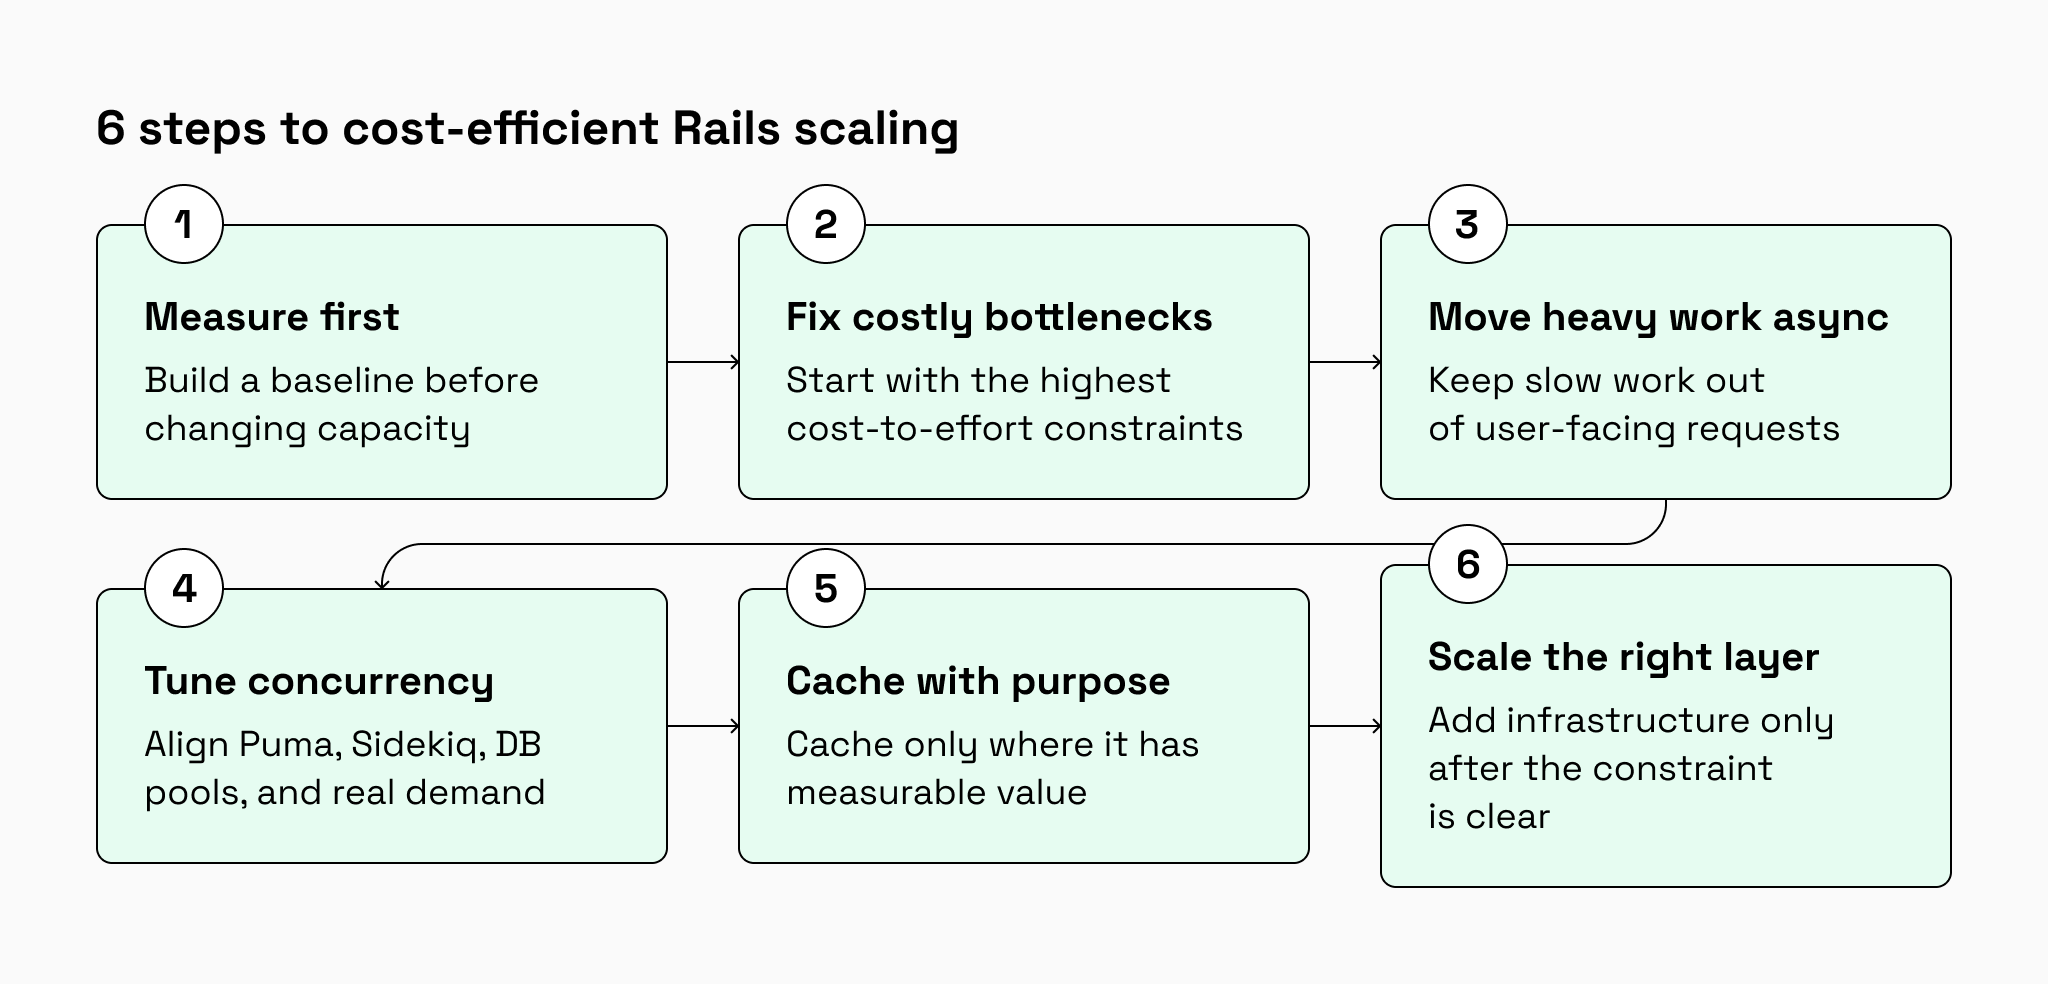
Below is the sequence of steps we recommend. The key discipline is simple: don’t move to the next step until the current one is validated with data.
Step 1: Build a baseline before changing capacity
Before changing instance sizes, autoscaling rules, or database tiers, build a baseline that connects cloud spend with Rails application behavior.
Track:
- Request latency by endpoint, database time, external HTTP calls, and background job traces in Scout APM or New Relic.
- Slow, frequent, and expensive SQL queries with
pg_stat_statements. - N+1 query patterns with Bullet in development or staging.
- Sidekiq queue latency, retry volume, and job execution time.
- Puma worker memory, ActiveRecord connection usage, and garbage collection behavior.
- Application memory footprint and object allocations with
derailed_benchmarksandmemory_profiler. - CPU-heavy Ruby code paths with
rbspyorstackprof. - Infrastructure utilization: CPU, memory, network, disk, Redis, storage, logs, and egress.
- Cloud spend by service: compute, database, Redis, storage, logs, and egress.
- Cloud dashboards show where money is spent. Rails diagnostics show why the application needs that capacity in the first place.
If you need a fuller list of what to measure in production, our Rails performance optimization checklist covers response time, database query time, memory usage, background job latency, error rate, throughput, and other key signals.
Step 2: Fix the constraints with the highest cost-to-effort ratio
Once the bottleneck is visible, start with the issues that create the most waste and can be fixed without changing the infrastructure footprint. In Ruby on Rails apps, these are often practical, accumulated problems rather than deep framework limitations.
Focus on:
- N+1 queries that multiply database load
- missing or inefficient indexes
- endpoints that load more data than they need
- large ActiveRecord objects where a few fields would be enough
- slow queries scanning large tables
- lock contention during high-volume operations
- Puma, Sidekiq, and database pool settings that do not match real concurrency
A common pattern is an idle CPU with threads still waiting. The application has compute available, but Rails threads spend time waiting for free database connections or for PostgreSQL to finish queued work. Teams often try to solve this by increasing pool sizes, but larger pools do not always mean higher throughput. We regularly see Rails database pools configured at 40–60 connections, while PostgreSQL starts queueing or slowing down long before that capacity is useful.
These fixes often release capacity the company is already paying for. Response times improve, database pressure drops, and the need for a larger database or more application servers becomes easier to evaluate instead of being treated as the only option.
Step 3: Move heavy work out of the request cycle
A slow user-facing request is often doing work that does not need to happen while the user waits. Reports, emails, imports, CRM syncs, payment follow-ups, and third-party API calls can occupy web threads long after the useful part of the request is finished.
Move non-critical work into background processing, especially when it involves:
- external API calls
- file imports or exports
- PDF or report generation
- bulk updates
- email and notification delivery
- image or media processing
- analytics, CRM, or marketing automation syncs
This keeps web capacity available for actions that directly affect the user experience: sign-up, checkout, search, dashboard loading, and other core flows. Latency becomes more predictable, and the application can handle more real traffic before more web servers are needed.
Step 4: Tune concurrency around the database, not around optimism
Adding more Puma threads or Sidekiq workers only helps when the rest of the system can absorb the extra concurrency. If the database is already the limiting factor, more application processes usually create longer waits, higher memory usage, and more timeouts.
Align the main concurrency settings across the stack:
- Puma workers and threads
- Rails database pool size
- Sidekiq concurrency
- database max connections
- Redis capacity
- Kubernetes, ECS, or Heroku scaling rules
- real traffic patterns and peak behavior
This step prevents the application layer from overwhelming the database or queue system. The result is steadier throughput, fewer connection bottlenecks, and less money spent on servers that mostly wait for another part of the stack to respond.
Step 5: Use caching where it has measurable value
Caching can reduce database load and improve response time, but it needs boundaries. Otherwise, Redis or Memcached becomes another expensive place to store data nobody reads.
Prioritize caching for:
- expensive queries used on high-traffic pages
- computed values reused across many requests
- page fragments that are costly to render
- data that changes infrequently
- safe responses from slow external services
Avoid or review caches that contain:
- large serialized objects
- user-specific data with little reuse
- keys without expiration
- data that is written often but rarely read
- cache entries with unclear invalidation rules
A disciplined caching strategy reduces repeated work without creating another uncontrolled cost center. The database gets relief, high-traffic pages respond faster, and Redis memory stays predictable.
Once these steps are validated, infrastructure scaling becomes a clearer decision. Add web capacity, database resources, background workers, Redis memory, or observability volume only when that layer is the actual constraint. In many Rails systems, smaller load-balanced instances provide better resilience than one large server, but only when the application, database, queues, cache layer, and autoscaling rules are tuned together.
At that point, scaling becomes a controlled investment: you spend more because demand requires it, not because the system is hiding inefficient code, blocked threads, overloaded queues, or poor utilization.
Conclusion: fix Rails infrastructure waste
Rails infrastructure costs rarely grow without a cause. If traffic is stable but cloud spend keeps rising, the issue is usually measurable: slow queries, blocked Puma threads, oversized workers, growing Redis memory, noisy logs, retry storms, or poor autoscaling rules.
The right approach is to find the constraint first, remove the waste, and only then add capacity where it is truly needed. This keeps scaling tied to real demand instead of inefficient code, misconfigured queues, or idle resources.
Rails infrastructure optimization takes time, experience, and a clear view of how the whole system behaves under load. If your team cannot investigate every layer in depth, delegating this work to Rails professionals is often the fastest way to protect performance, control cloud costs, and scale without turning infrastructure into an expensive guessing game.